")
MANUFACTURING INDUSTRY 2014 REPORT
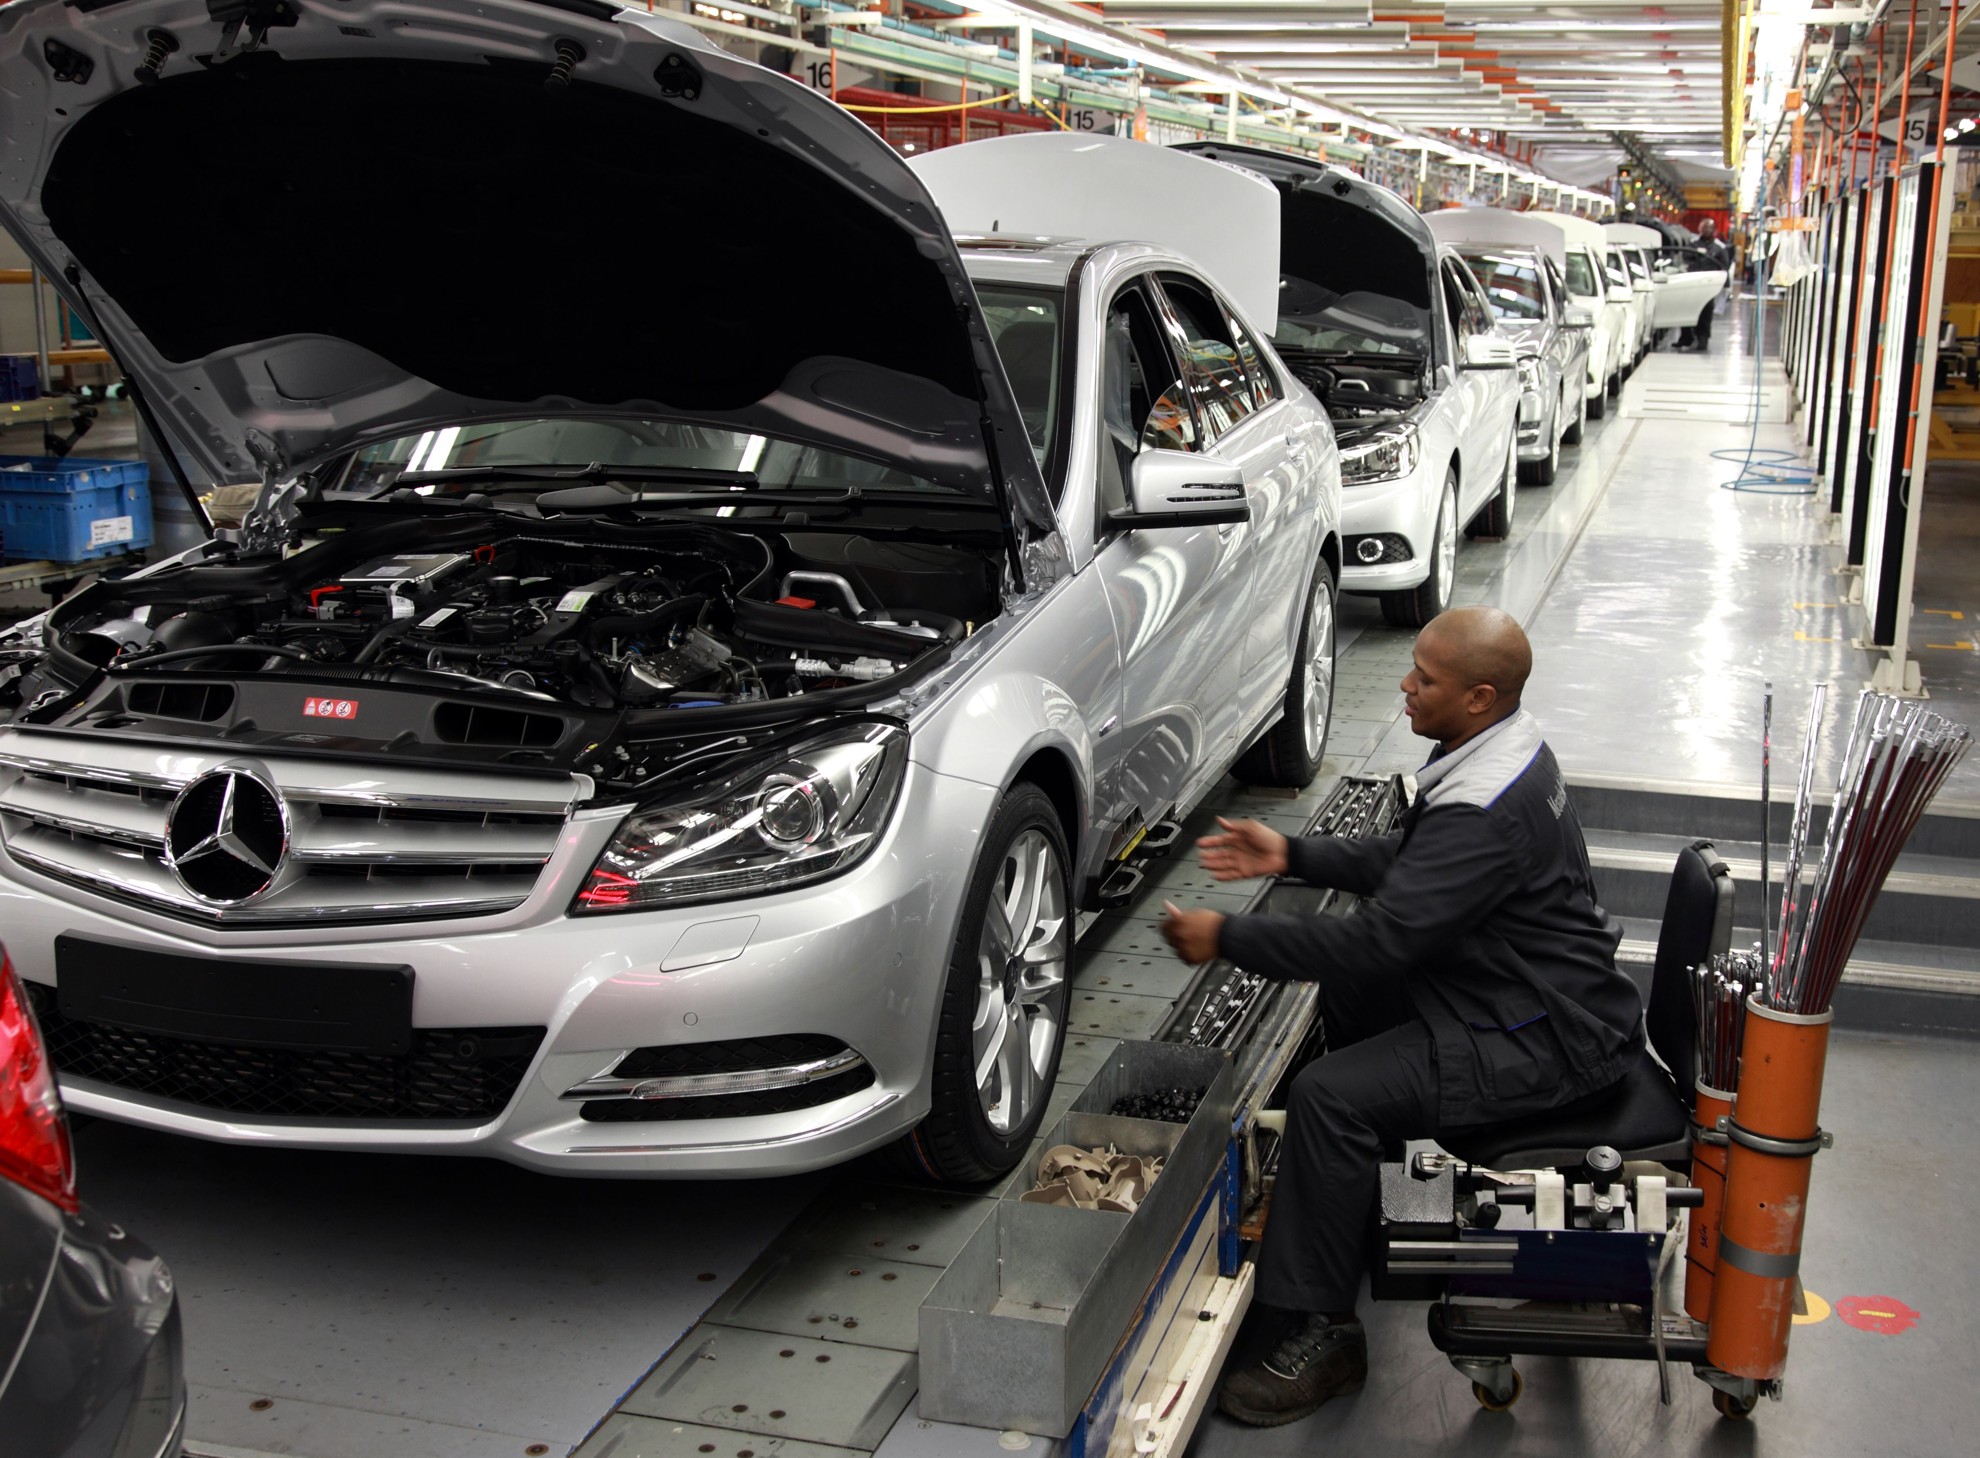
Statistics South Africa (Stats SA) today released the Manufacturing industry, 2014 report which indicates that the total income for the manufacturing industry has increased by 9,4% per annum, from R1,68 trillion in 2011 to R2,20 trillion in 2014. Comparing 2011 and 2014, large increases were reported for ‘coke, petroleum, chemical products, rubber and plastic’ (+R248,1 billion), ‘food products and beverages’ (+R88,6 billion) and ‘transport equipment’ (+R81,3 billion). The contribution of the top 100 enterprises (CR100) has risen from 53,5% in 2005 to 58,1% in 2014.
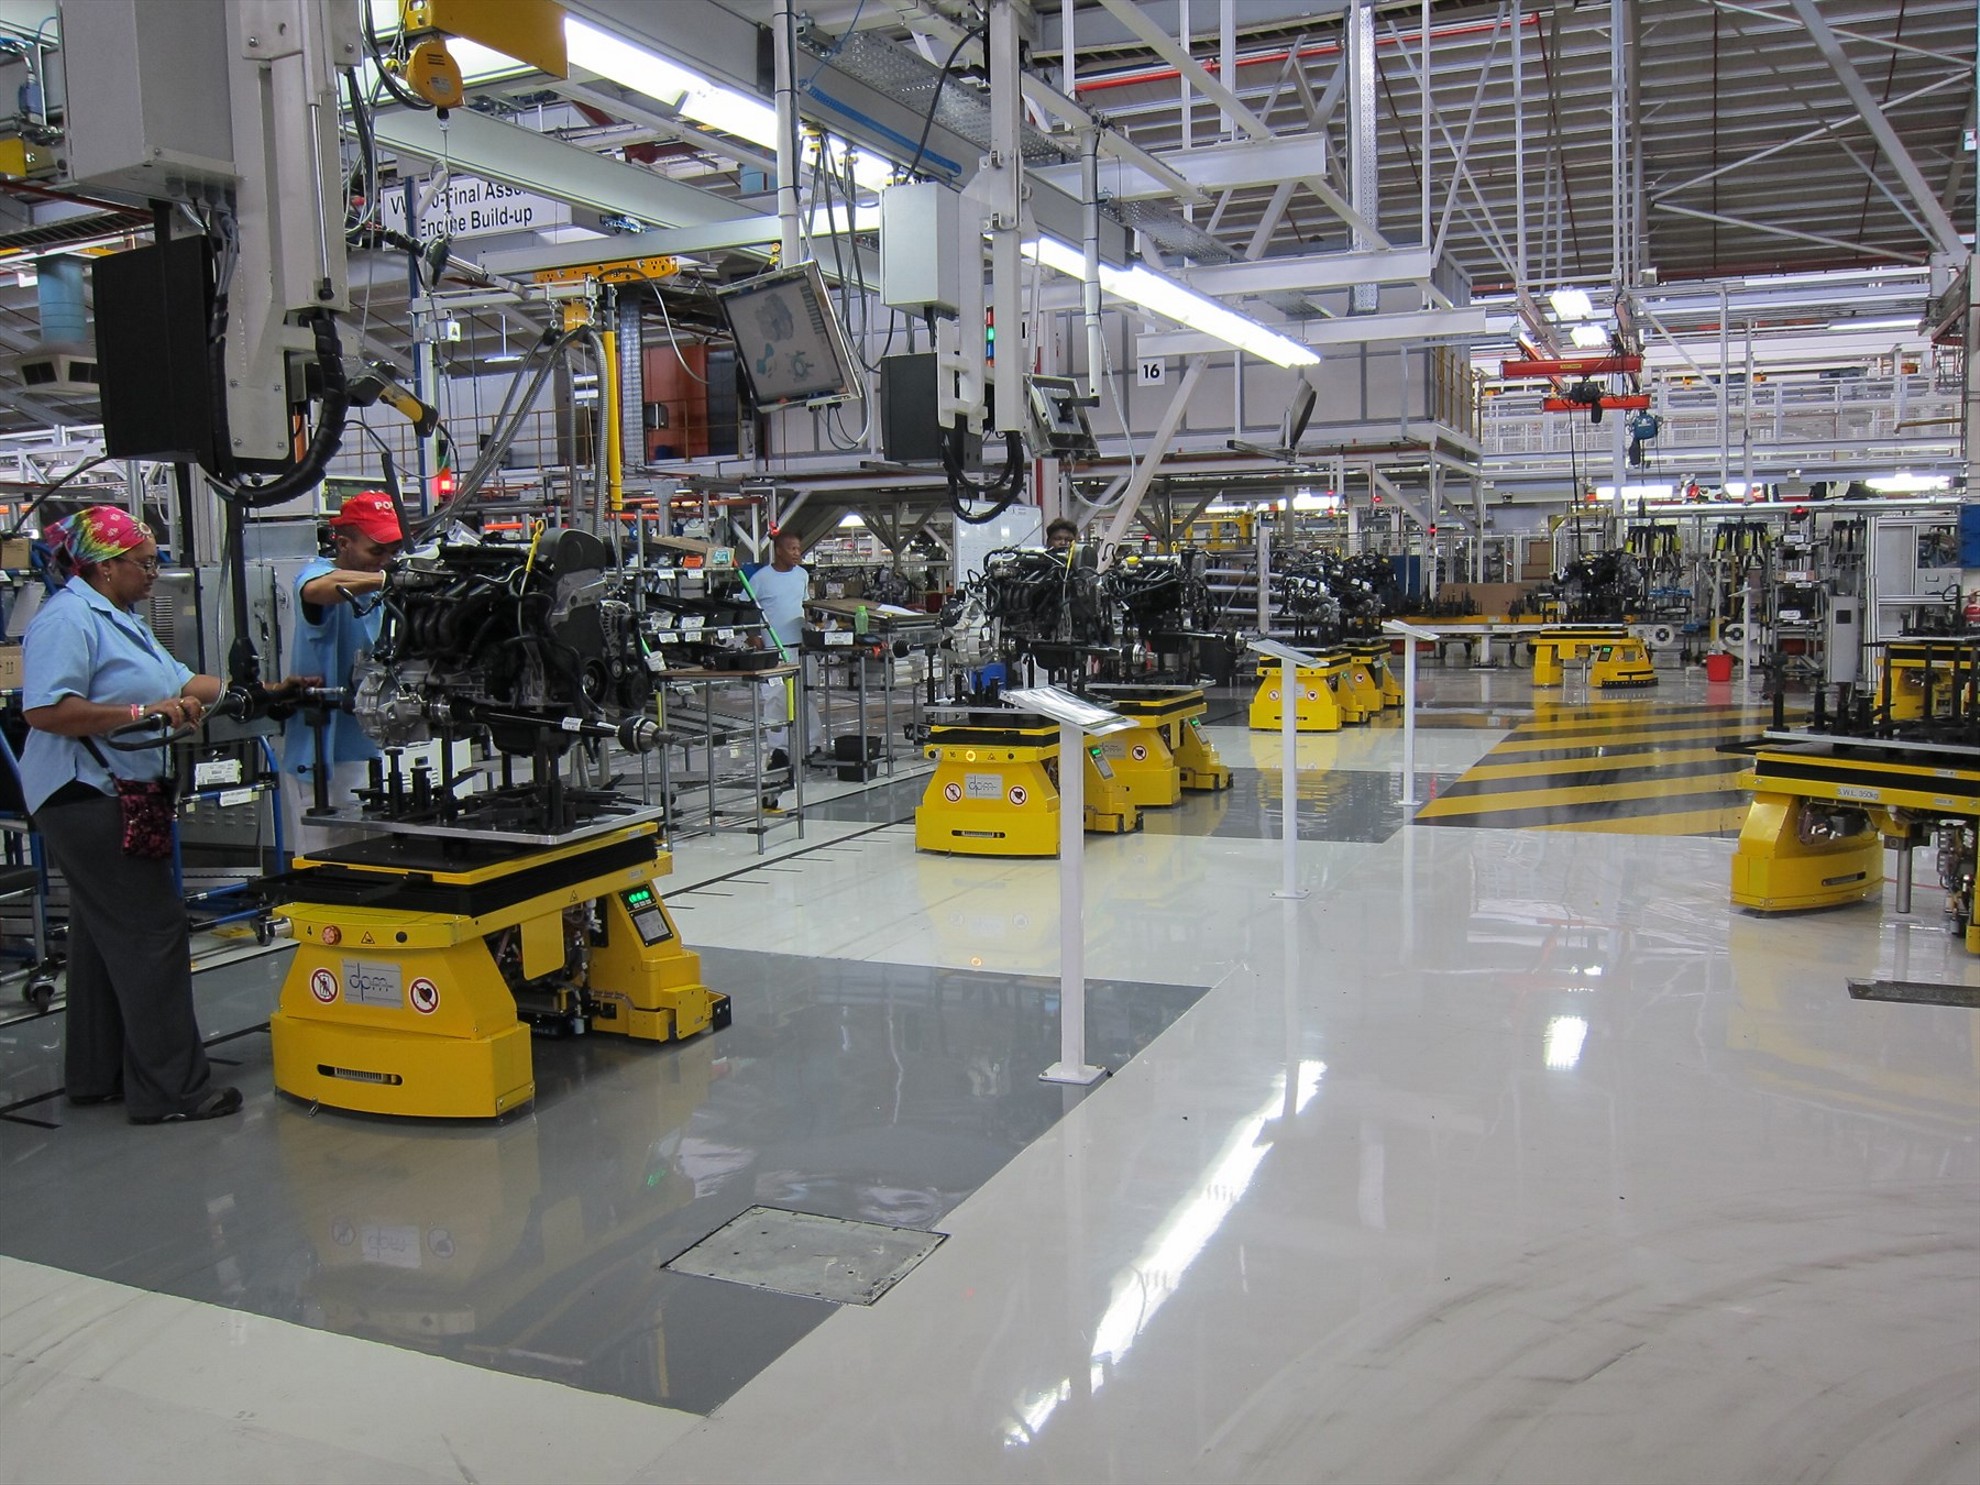
The report further indicates that employment has declined from a high of 1 436 000 in 2005 to a low of 1 190 000 in 2014 (a loss of 246 000 jobs). The biggest loss in employment was in ‘textiles, clothing, leather and footwear’ (-91 000), ‘food products and beverages’ (-52 000), ‘metals, metal products, machinery and equipment’ (-35 000), ‘furniture, other manufacturing and recycling’ (-32 000) and ‘transport equipment’ (-30 000). Jobs were only gained in ‘coke, petroleum, chemical products, rubber and plastic’ (+20 000).
Also, large enterprises contributed only 46,4% of employment whereas the small, medium and micro enterprises (SMMEs) created 53,6% of employment.
The districts with the largest income from sales of goods and services were ‘Cape Town’ with R366,2 billion (or 17,3% of the industry total), ‘Johannesburg’ (R342,0 billion or 16,2%), ‘Ekurhuleni’ (R268,8 billion or 12,7%), ‘eThekwini’ (R228,7 billion or 10,8%), ‘Tshwane’ (R145,7 billion or 6,9%), ‘Gert Sibande’ (R135,9 billion or 6,4%) and ‘Nelson Mandela Bay’ (R111,3 billion or 5,3%).
However, ‘Johannesburg’ had the highest employment (312 000 or 26,1%), followed by ‘Cape Town’ (157 000 or 13,2%), ‘eThekwini’ (156 000 or 13,1%), ‘Ekurhuleni’ (115 000 or 9,7%), ‘Nelson Mandela Bay’ (61 000 or 5,2%) and ‘Cape Winelands’ (51 000 or 4,3%).
Note to editors:
The manufacturing industry large sample survey is a periodic survey conducted every three to five years covering business enterprises registered for tax in South Africa. Results of the survey are used within Stats SA for benchmarking national accounts (e.g. the gross domestic product (GDP)), compiling supply-use tables. These statistics are also used by the private sector in analyses of comparative business and industry performance.
Since 1996, the survey was previously conducted for the reference years 2001, 2005, 2008, 2011 and 2014
Technical enquiries: Mr Joe de Beer Tel: (012) 310 8024
Cell: 082 888 2600
Email: This email address is being protected from spambots. You need JavaScript enabled to view it.
Media enquiries: Ms Lesedi Dibakwane Tel: (012) 310 8578
Cell: 082 805 7088
Email: This email address is being protected from spambots. You need JavaScript enabled to view it.
The full statistical release is available on the Statistics South Africa website: www.statssa.gov.za
Issued by GCIS on behalf of the Statistics South Africa
26 September 2016